The City in Space: Racial and Economic Segregation in NYC
I’ve never really spent much time playing around with census data and I figured that now’s as good a time as any to start learning how it works. So I jumped in and started to get my hands dirty. You won’t be surprised that I was interested in race and income distribution in NYC.
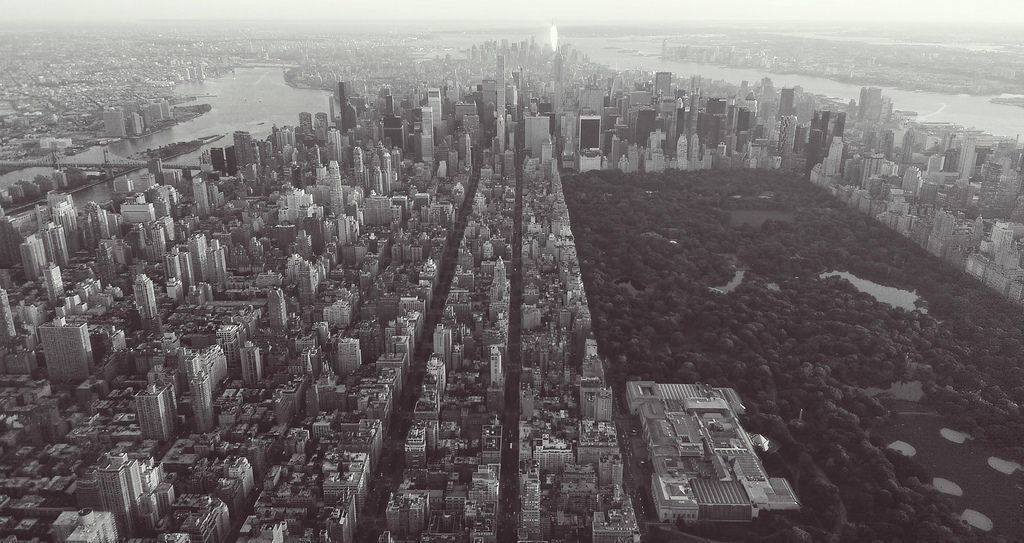
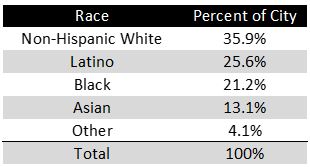
Many people in New York are surprised to hear how segregated individual neighborhoods are. We spend a lot of time walking around Midtown or riding the C train or hanging out in any part of the city where we’re bound to see lots of people of lots of different racial and ethnic backgrounds. After all, no racial group makes up more than a third* of the city: non-Hispanic whites make up 34% of the city, Latinos make up 27%, African Americans make up 23%, Asians make up 12% and the remaining 4% are from all over the world.
These numbers, however, mask some pretty big differences among neighborhoods and blocks. As the map below shows, most neighborhoods are primarily made up of a single race:
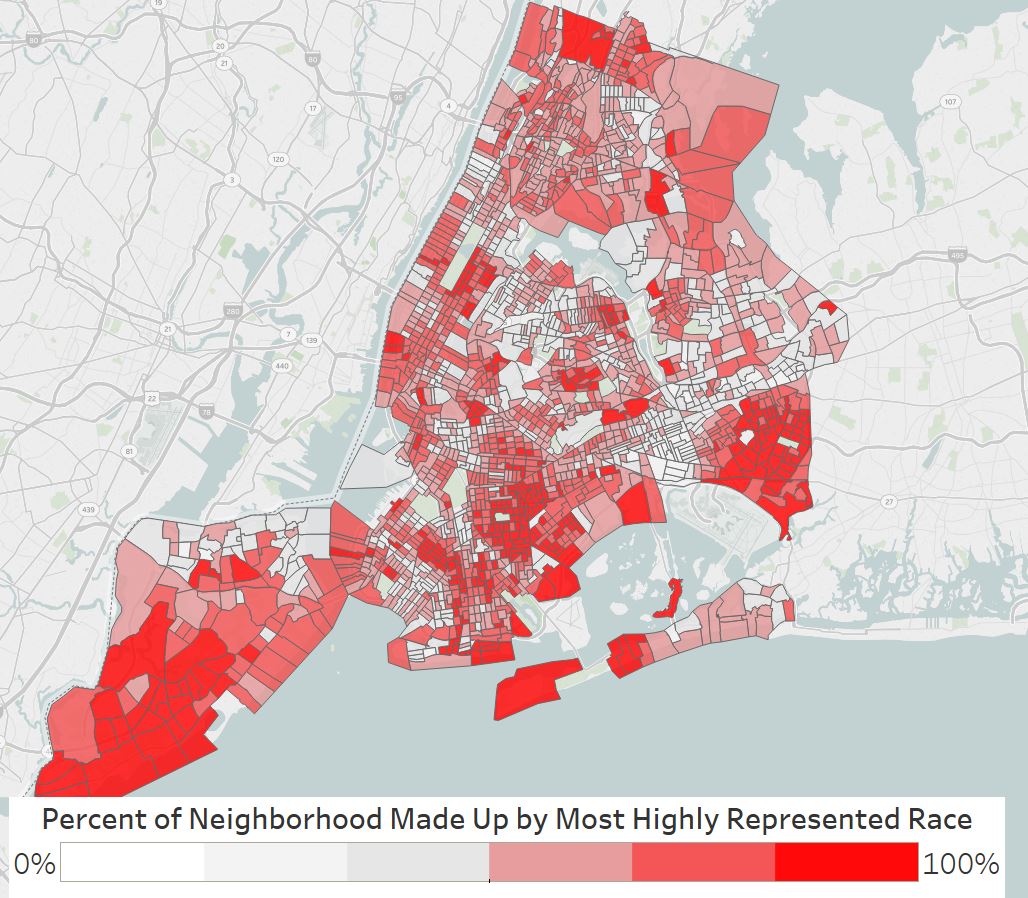
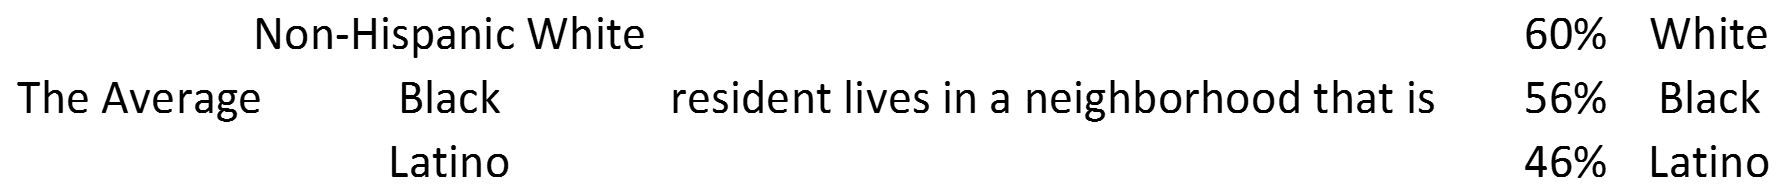
In fact, in the median census tract 64% of folks are from the same race, and in more than 75% of census tracts at least a majority of residents are from the same race. There are some pretty big differences between races, however: the average white NYC resident lives in a tract that’s 60% white, while the average black resident lives in a tract that’s 56% black. Considering the fact that more city residents are Latino than black, it is surprising that the average Latino is much less segregated: the average Latino lives in a neighborhood that’s only 46% Latino. The trend, however, is clear: all races are much more likely to live in neighborhoods that look more like them than the city does as a whole**.
It’s not necessarily surprising that there is some racial sorting in residential patterns in the city. Immigrants, of course, are likely to settle in areas where there are people they know from their original homes. People are also likely to settle in neighborhoods where a plurality of residents share similar cultural backgrounds, such as the Jewish community in Crown Heights. As Ed Soja writes in Seeking Spatial Justice,
Not all examples of residential segregation are entirely unjust. To some degree, residential segregation can be voluntary and beneficial, with people of similar background choosing to live together for many different purposes, from creating identity and community to eating preferred food and obtaining other forms of nourishment and cultural sustenance to helping new arrivals to find jobs and housing.
However, as we know from countless studies and accounts, much of this segregation is not due to the preferences of new residents. Much of it is, in fact, thanks to both de jure and de facto segregation imposed by the state, by private lending practices, and by individual sentiment about living around other types of people. As Soja goes on to note,
Segregation becomes a problem… when it is rigidly imposed from above as a form of subjugation and control, as with apartheid and racial ghetto formation; or when it emerges less intentionally from below as an oppressive by-product of unregulated “freedoms” of choice operating within persistent spatial structures of advantage.
We know that places and spaces within cities aren’t separate or immune from the other structural issues impacting our cities. But in New York, how are income and race distributed throughout our neighborhoods? If we bring in average incomes in the neighborhoods around the city, pernicious patterns start to reveal themselves. For instance, look at these two maps. The left-side map shows the mean income by census tract. The right shows the percent of residents in each census tract who are non-Hispanic whites:
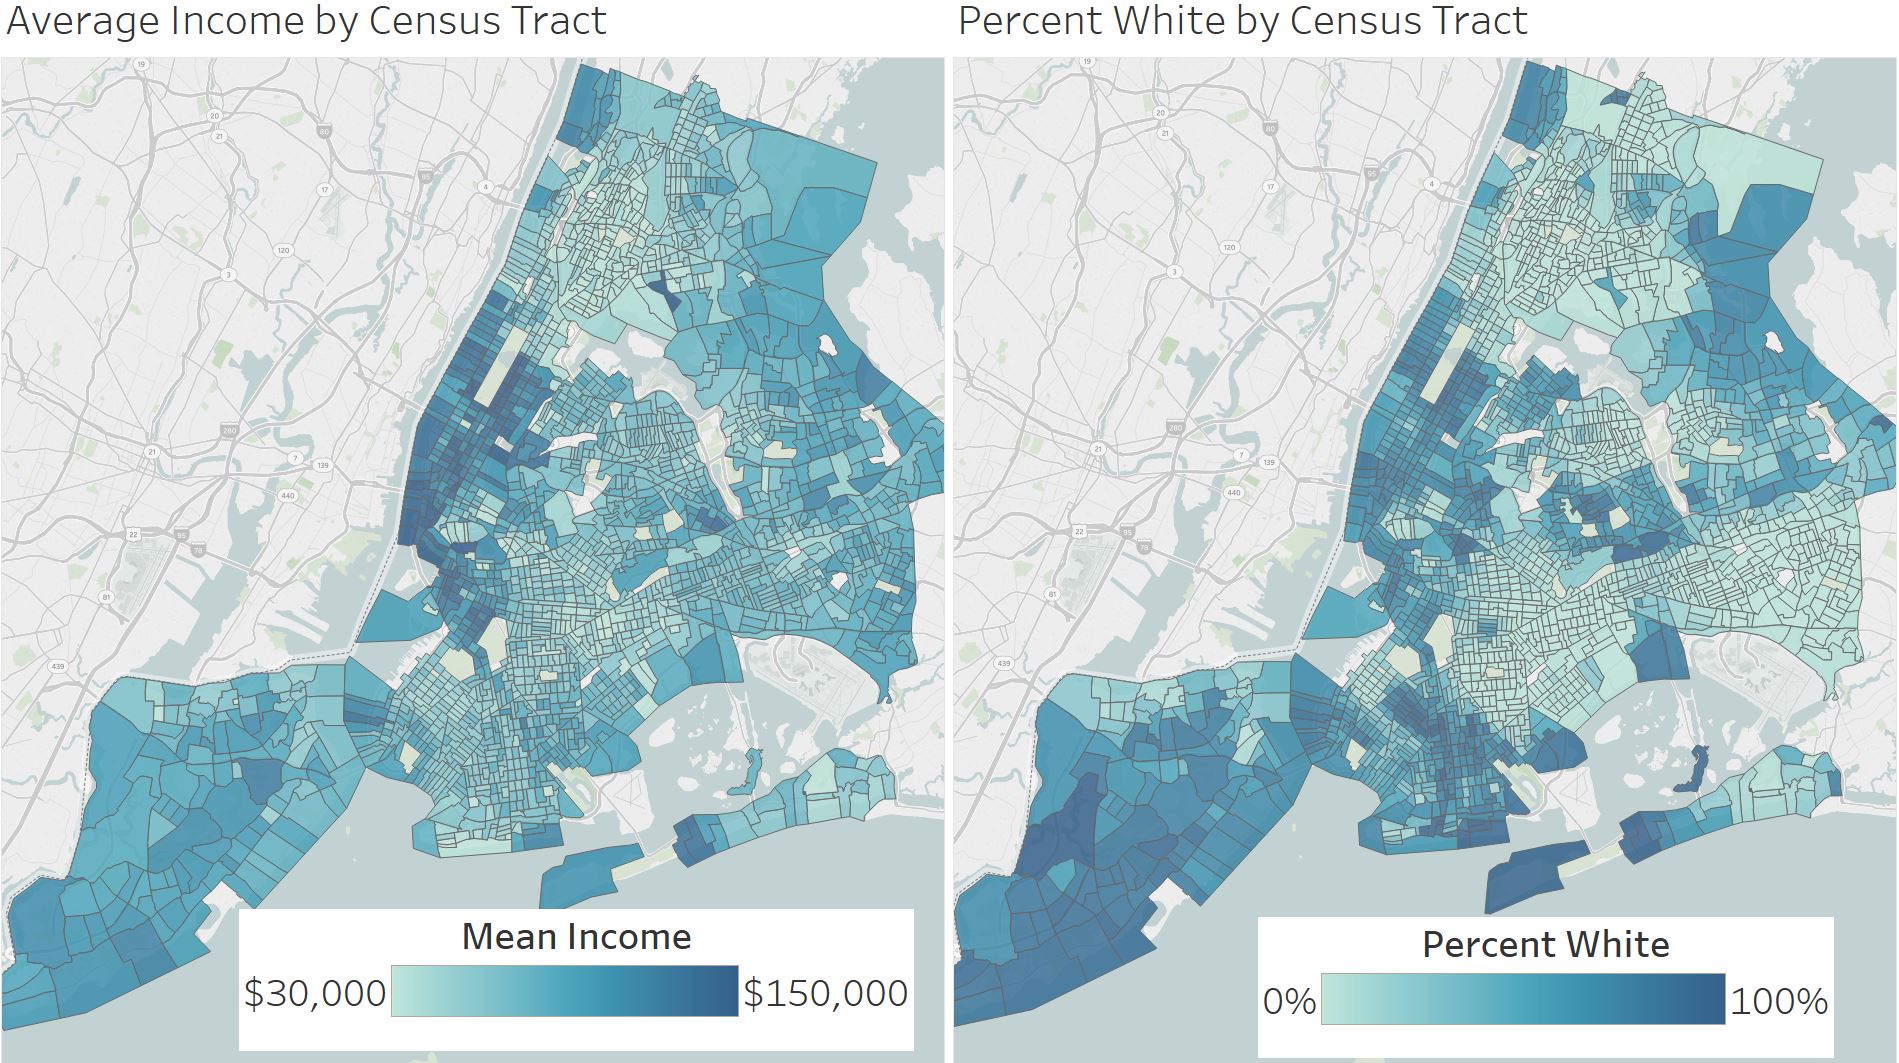
The whiter a census tract, the higher its average income. In fact, the 751 census tracts that are at least 50% non-Hispanic white have a mean income of $102,000 while the 1,416 census tracts where whites make up less than 50% have a mean income of only $59,000. Conversely, in the 494 tracts where African Americans make up at least 50% of the population have an average income of $59,000 while the others have $79,000. Finally, in the poorest 10% of census tracts, whites make up less than 7% of the population. In the 10% with the highest incomes, they make up 74%. These numbers are big, and they’re meaningful.
A 1% increase in the percentage of the population that’s white is correlated with an increase in average income of over $7,300 per year. Increasing the percentage of African Americans by the same amount? A decrease of $4,400. Though these don’t account for other factors such as education, the numbers are still stark. Meanwhile, as the percentage of a neighborhood that’s a single race goes down, average incomes go up (at least in neighborhoods that aren’t currently mostly white). Ultimately, segregation is associated with higher incomes for white residents, and lower incomes for everyone else. That’s a problem.
If we look back over the past few years, a few other trends can be seen. To see neighborhood changes in the past half-decade have occurred, I looked at ACS data from 2011-2015. Over this time period, if neighborhoods became whiter, their income went up as well. And, perhaps most troubling, the whiter a census tract was in 2011, the more their income went up between 2011 and 2015. Thus, the census tracts with the highest starting incomes also saw the biggest increases in income over the five year period roughly corresponding to the recovery from the recession.
It’s important to remember that these differences aren’t just the product of personal choice, or even differences in income. The average African American family making more than $100,000 lives in a neighborhood whose average income is only $72,000, while comparable number for white families is $106,000. Why are black families and white families making the same amount of money living in such different neighborhoods? Why don’t high-income black families move into higher-income neighborhoods? There’s a lot of damning research out there: black families continue to face discrimination in mortgage lending, steering from real estate agents, and perceived animosity in white neighborhoods.
The public school system, political representation, transit funding, and other aspects of public life are spatially determined (and more likely to be provided in wealthy neighborhoods). The fact that whites are represented twice as much in the wealthiest neighborhoods as in the city as a whole means that residential patterns are reinforcing racial wealth and income disparities. Our neighborhoods are separate. And they’re not equal.
We spend a lot of time talking in this city about gentrification, and we need to. Displacement in long-standing neighborhoods is an enormous issue, but it’s not the whole story. Poverty and inability to afford basic necessities is concentrated in neighborhoods that aren’t attractive to gentrifiers. As Matthew Desmond wrote last year:
Only a small portion of poor, minority neighborhoods are affected by gentrification. Perhaps gentrification enjoys heightened visibility by community activists, journalists, and students because gentrification often is regularly visible to those groups. Its effects are seen in beloved, hip neighborhoods where we shop, eat, and live. If we knew the South Bronx as well as we know Harlem, Woodlawn, or Wicker Park—if we travelled to the heart of the ghetto, instead of lingering at its edges—perhaps it would become clear to us that the major source of displacement, by a wide margin, is not gentrification but the fact that millions of people cannot afford rent even in some of our cities’ worst neighborhoods.
Whew. Thanks for sticking with me as I threw a bunch of statistics at you. I’m still mulling over what they all mean, and how they should inform any policy response. But at the end of the day, the census data presents some pretty stark findings: New Yorkers continue to live in segregated neighborhoods nearly a half-century after the passage of the 1968 Fair Housing Act. That segregation is hurting everyone in the city – except for the whites who have been able to wall themselves off.
* All single-year data comes from the 2015 ACS (the latest year for which data is available). The regressions of 5-year income change use ACS 2011-2015 data.
** In American Apartheid Douglas Massey and Nancy Denton construct a clever way of measuring levels of segregation in an area. They call it the dissimilarity index. Basically, it identifies the number of individuals of a racial group who would need to move in order for every neighborhood to reflect the same demographic makeup of the city. I am not recreating it for NYC. What do you think this is, my job??
If you want to use any of the raw data that I downloaded and got into usable formats I’d be happy to send it your way.
3 thoughts on “The City in Space: Racial and Economic Segregation in NYC”
Spent the evening at a lecture about the future of Baltimore. I was disappointed that the speaker insisted that the offer of housing in non-white neighborhoods to families that will be displaced when the City sells off additional public housing for redevelopment are somehow a voluntary community. Certainly friendships have been generated as families move into developments leave. Move-outs (people who age-out or find the finances to leave) provide vacancies for an overflowing list of other poor black families. These developments are not true communities, but simulated neighborhoods built to be filled with poor black families. Whites have abandoned pursuit of a position on the list, and Hispanic families are relatively recent arrivals to the region and are at the bottom of the list.
Pardon my straying from a responsive post, but I would love to see how those census tracts are broken down into their block groups or even blocks to see how well races live together before a tract moves from one ethnic designation to another. New York City’s gentrification is an issue almost totally unknown in Baltimore. The population is generally moving out. This trend includes African American families with good credit and a willingness to move to generally hostile adjacent jurisdictions.
Do we want to live together? Who is making that happen? Please let me know if you have discovered any place at whatever scale that is making a conscious mix happen.
Hey Steve,
Thanks as always for sharing your thoughts – you always set me off thinking about new things I hadn’t considered yet, and I appreciate that!
I think you’re absolutely right about how communities formed in public housing are often treated as expendable. We obviously did that in the 1960s and 70s during urban renewal, but often people are “baffled” that folks aren’t willing to move immediately with a voucher program or similar initiatives. I think community may well be part of why we see higher-income African American families living in lower-income neighborhoods than their white counterparts.
I did all of the analysis at the block and the tract level in the post above, and the results weren’t meaningfully different. I decided to just stick with the tract level for the post since that tends to be more standard. I’d be really interested in seeing what Baltimore looks like, too!
I’m currently reading a great book I encourage you to check out called Stuck in Place: Urban Neighborhoods and the End of Progress toward Racial Equality, by Patrick Sharkey. He looks at changes in residential distribution since the 1968 FHA – what he finds is pretty damning.
I lived in the suburbs of Baltimore for my first 19 years, then 5 years of college, after which I returned to live in the City, a separate jurisdiction from my Baltimore County. I worked as a City employee during the time people were describing its renaissance.
40 years later, racial integration still is only a dream. What’s disappeared is the desire for integration. The City population gradually shrinks, with the State of Maryland increasing slightly. But working in in 1999 with a nonprofit created to encourage City living, the market studies said that their interviews were only positive when they spoke with people from outside the region. Those who lived nearby with any possible interest in moving to the City were heavily skewed toward empty nesters and childless couples. So, at the request of the organization’s board, the report was never published.
Prior to the nonprofit job, I had been part of the City’s court-mandated public housing desegregation program staff. I sat at the table when our lawyers first announced a proposed settlement, which would relocate 2200 families from four “high-rise” public housing developments to census tracts that met the Baltimore region’s demographic profile: 30% non-white and 70% white. The quote I remember from my boss – the City’s Housing Commissioner – was “this is ridiculous – Black people don’t want to live next to white people.” He lived in a high-income African American neighborhood.
Baltimore has never said the words “Chocolate City” out loud, but in meetings of elected leaders, that principle was espoused. “To be like Atlanta.” Thinking has evolved, mostly because HUD (a co-defendant of the City) has kept pushing. But the idea that I described yesterday – don’t break up these poor Black neighborhoods and cause people to relocate – still does not have strong advocates, even if the idea is couched in terms of people “moving to opportunity.”