Race in Boston
Recently I wrote up some first messy reflections to the first two articles in the Boston Globe’s Boston. Racism. Image. Reality. series. I played with the identity part of the equation, and argued that when one narrative dominates What a Bostonian Is it should come as no surprise that the result is messy. The series is damning and uncomfortable and expertly done and necessary – if you haven’t read it, I’d encourage you to at least go read the intro piece (linked above).
The Globe series takes us through a number of different settings in Boston in which black residents are severely under-represented. They spare no holy ground: at Sox game at Fenway last summer, for instance, they note that fewer than 2% of attendees were black. Similar shares were in attendance at Patriots games and the Museum of Fine Arts. The Globe’s team didn’t spend too much time getting into the spatial aspects of Boston residential patterns, though, so I’m following up and reproducing some of the analysis I did with census data in New York City.
The Globe series notes that the median African-American household in Greater Boston has just $8 in wealth, compared to (I’ll let you sit down) $247,500 for the median white household. That’s right – the wealth of the typical white family in Boston is more than thirty thousand times that of the typical black family. That’s a staggering difference, and bears virtually no relation to the national black-to-white household ratio of 1:8.
A quick note: most of the Globe’s analysis looks at the Boston metro-area. I’m looking just at Suffolk County, which includes Boston, Revere, Chelsea, and Winthrop. This likely underestimates the discrepancies. Brookline, for instance (the area carved into the map on the middle of the western edge of the city), is an independent city. The median household income is $102,175 (compared to $58,516 in the city of Boston) and 3.2% black (compared to 22.8% in Boston). Believe it or not, I’m not just blowing smoke out my rear-end when I say that suburban municipalities exist to allow wealthier, whiter people to benefit from the economic powerhouse of the city while avoiding paying for the poorer people who live there.
So how are white and black residents distributed throughout the city? And how does income and wealth interact with that? It’s not pretty. We’ll start with a couple of maps. You don’t need statistics to see the distributions – they’re clear to the naked eye.
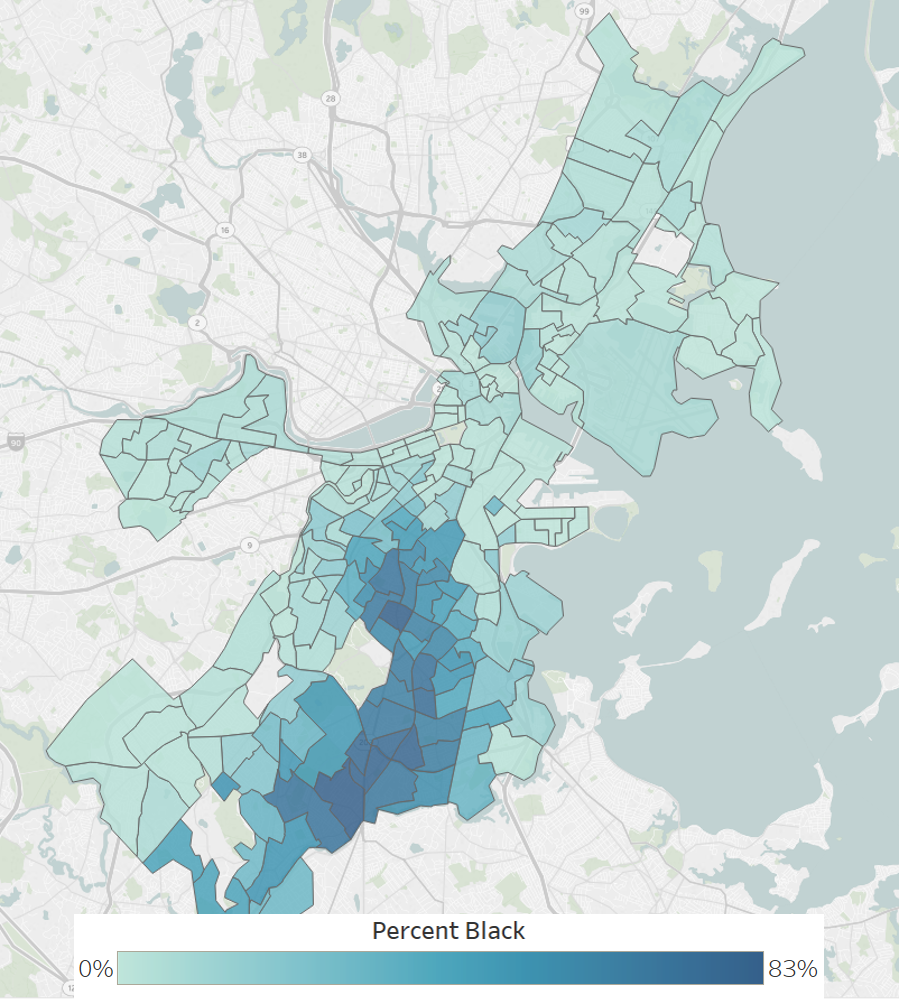
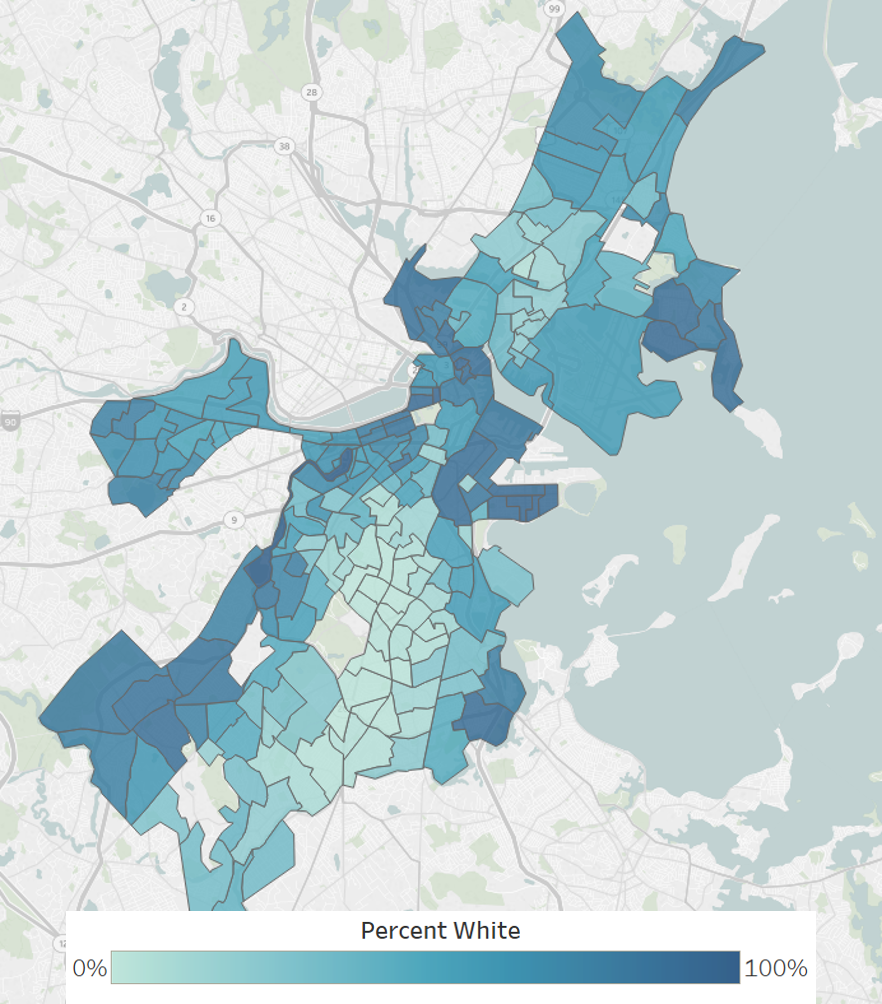
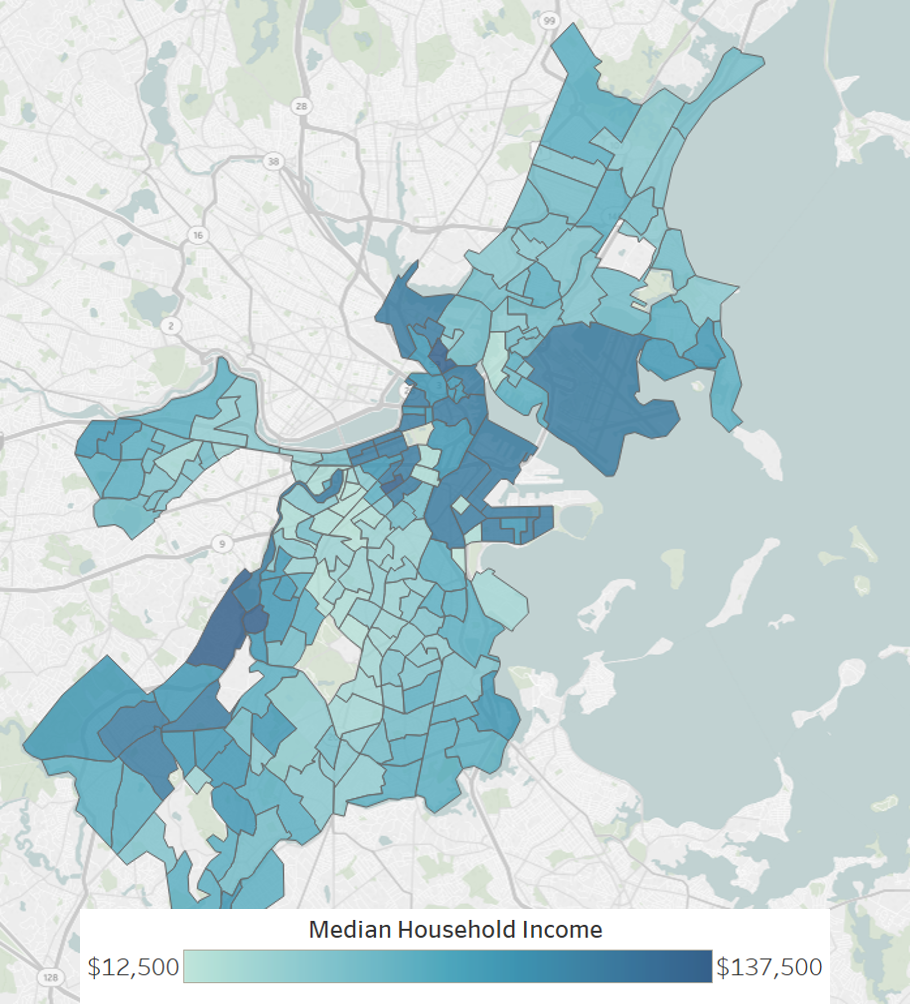
It’s pretty clear: the income and percent white maps are nearly identical, and almost the opposite of the percent black maps. The census tracts where black families are most prevalent in Roxbury and Dorchester are also the poorest census tracts.
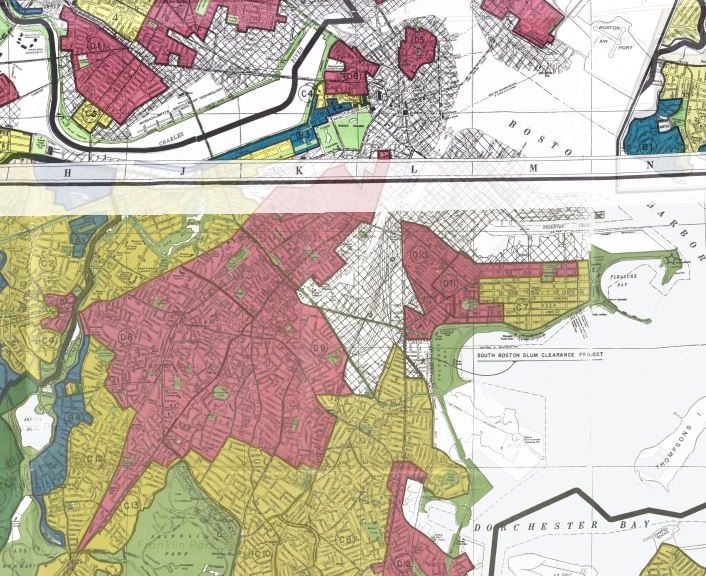
In fact, in the 10 census tracks with the highest income, black residents make up just 2.6% of the population. In the 10 with the lowest income? They’re a full 86.4% of the population. More broadly, the average white resident of Suffolk County lives in a neighborhood where the median household income is more than 25% higher than that in the average black resident’s neighborhood. Much of this can be traced back to the history of redlining and racial segregation in the city – compare these maps to the map at the top of the post, an HOLC map from the 1930s.
Of course, since we’re talking about race in an American city, the story doesn’t end there. That large swath of census tracts through the south-central part of the city faced one of the most egregious examples of urban disinvestment of the twentieth century. For the transit / urban history nerds in the audience, I’ll recommend Kris Carter’s 50 minute documentary Equal or Better: The Story of the Silver Line. For everyone else, a brief history:
The MBTA’s Silver Line provides service down Washington Avenue into the neighborhoods around Roxbury. Unlike all the other thickly-drawn lines on the map, however, the Silver Line isn’t actually rail service: it’s a bus. From 1901 to 1987, there was an elevated train that traveled the route, but it was torn down and never replaced. Instead of ensuring high-quality transportation access to a lower-income and minority neighborhoods where car ownership is less common, the MBTA instead decided to plow capital funding into an expansion of the commuter lines into the wealthier neighborhoods surrounding Boston proper.
These neighborhoods remain notoriously difficult to get to. I spent a summer in college splitting my time between Rosie’s Place (a woman’s shelter) and the Suffolk County House of Corrections, both of which are in the Roxbury section of the city and consistently marveled at its inaccessibility. Whether it’s thanks to intentional exclusion, utter disregard, or something in between, the bus’ replacement of an elevated train is a stain on Boston’s history. The Boston Planning and Development Agency lack of a single black planner in a leadership position is telling.
The Globe’s piece on the newly-developed Seaport neighborhood shows that the city has learned little. The neighborhood received north of $18 billion in public money, but the city has done nothing to influence who lives there. White residents are over-represented compared to the entire county by 2:1, and just 0.45% of mortgages (3 of 660) have been issued to black individuals. This is nothing short of scandal, a use of the public purse to reinforce white wealth and white segregation.
No one is saying this isn’t a complicated issue. No one is saying the answers are simple. The developers say that they hire predominantly white construction firms because black-led and minority-led firms don’t have expertise. They say that market forces determine who lives in their buildings, and that it isn’t their fault that minorities in Boston can’t afford the prices for their units. But that’s exactly the problem – racial disparities in Boston and around the country aren’t today the “fault” of anyone in particular.
That means that everyone is responsible for shouldering the cost of changing the system.
It means, in the case of development in the Seaport, that the city require developers to take a risk on a lesser-known firm to do some of the work. It also means that the city should consider finding some way to insure developers against the risk of hiring newer firms if they’re led by minorities.
It means, in the case of Boston’s health care system, going no further than recognizing that low-cost insurance plans don’t cover great care. It demands wrestling with why black residents have worse health insurance and doing something about it.
It means that the MBTA should raise the fares on suburbanites who commute into the city. These folks are making more money than city residents while piggybacking off the transportation infrastructure. A small increase still won’t offset the taxes they’ve stolen from the community by moving to a wealthy suburb. That money should be plowed into increasing transportation links between lower-income communities and job centers.
It means that we don’t need another goddamn Manchester by the Sea next year. We get it – Boston is full of disaffected white guys with a violent streak. Yes, we like them apples, but there are other fruits in the city.
It means you – yes, you – should consider hitting up Darryl’s in Roxbury instead of another Legal Seafood for dinner this weekend. Or Wally’s Cafe instead of Fenway. It means engaging with and financially supporting the black owned institutions that promote a wider understanding of what “Bostonian” means.
At the end of the day, Boston has a long history of racism. Doing nothing in response to that history isn’t an option: we either tacitly accept, benefit from, and reinforce that tradition or we actively seek to dismantle it. Full stop.